

1. Introduction
Natural proteins can fold their sequences into unique structures. Protein’s stability and foldability result from natural selection and are not typical characteristics of random polymers (Bryngelson and Wolynes, 1987; Pande et al., 1997; Ramanathan and Shakhnovich, 1994; Shakhnovich and Gutin, 1993a; 1993b). Natural selection maintains protein’s stability and foldability over evolutionary timescales. On the basis of the random energy model (REM) for protein folding, it was discussed (Ramanathan and Shakhnovich, 1994; Shakhnovich and Gutin, 1993a; 1993b) that the equilibrium ensemble of natural protein sequences in sequence space is well represented by a canonical ensemble characterized by a Boltzmann factor where is the folding free energy of sequence σ, GN and GD are the free energies of the native and denatured states, kB is the Boltzmann constant, and Ts is the effective temperature representing the strength of selection pressure and must satisfy Ts < Tg < Tm for natural proteins to fold into unique native structures; Tg is glass transition temperature and Tm is melting temperature. The REM also indicates that the free energy of denatured conformations (GD) is a function of amino acid frequencies only and does not depend on amino acid order, and therefore the Boltzmann factor will be taken as if amino acid frequencies are kept constant. It was shown by lattice Monte Carlo simulations (Shakhnovich, 1994) that lattice protein sequences selected with this Boltzmann factor were not trapped by competing structures but could fold into unique native structures. Selective temperatures were also estimated (Dokholyan and Shakhnovich, 2001) for actual proteins to yield good correlations of sequence entropy between actual protein families and sequences designed with this type of Boltzmann factor.
On the other hand, the maximum entropy principle insists that the probability distribution of sequences in sequence space, which satisfies constraints on amino acid compositions at all sites and on amino acid pairwise frequencies for all site pairs, is a Boltzmann distribution with the Boltzmann factor where the total interaction ψN(σ) of a sequence σ is represented as the sum of one-body (h) (compositional) and pairwise (J) (covariational) interactions between residues in the sequence; ψN(σ) is called the evolutionary statistical energy by Hopf et al. (2017). The inverse statistical potentials, the one-body (h) and pairwise (J) interactions, that satisfy those constraints for homologous sequences have been estimated (Ekeberg et al., 2014; 2013; Marks et al., 2011; Morcos et al., 2011) as one of inverse Potts problems and successfully employed to predict contacting residue pairs in protein structures (Ekeberg et al., 2014; 2013; Hopf et al., 2012; Marks et al., 2011; Miyazawa, 2013; Morcos et al., 2011; Sułkowska et al., 2012). Morcos et al. (2014) noticed that the ψN in the Boltzmann factor is the dimensionless energy corresponding to GN/kBTs, and estimated selective temperatures (Ts) for several protein families by comparing the difference (ΔψND) of ψ between the native and the molten globule states with folding free energies (ΔGND) estimated with associative-memory, water-mediated, structure, and energy model (AWSEM) (Davtyan et al., 2012).
A purpose of the present study is to establish relationships between protein foldability/stability, sequence distribution, and protein fitness. First, we prove that if mutation and fixation processes in protein evolution are reversible Markov processes, the equilibrium ensemble of genes will obey a Boltzmann distribution with the Boltzmann factor where Ne and N are effective and actual population sizes, and m is the Malthusian fitness of a gene. In other words, correspondences between and are obtained by equating these three Boltzmann distributions with each other; .
The second purpose is to analyze the effects (ΔψN) of single amino acid substitutions on the evolutionary statistical energy of a protein, and to estimate from the distribution of ΔψN the effective temperature of natural selection (Ts) and then glass transition temperature (Tg) and folding free energy (ΔGND) of protein. We estimate the one-body (h) and pairwise (J) interactions with the DCA program, which is available at “http://dca.rice.edu/portal/dca/home”, and then analyze the changes (ΔψN) of the evolutionary statistical energy (ψN) of a natural sequence due to single amino acid substitutions caused by single nucleotide changes. The data of ΔψN due to single nucleotide nonsynonymous substitutions for 14 protein domains show that the standard deviation of ΔψN over all the substitutions at all sites hardly depends on the evolutionary statistical energy (ψN) of each homologous sequence and is nearly constant for each protein family, indicating that the standard deviation of ΔGN ≃ kBTsΔψN is nearly constant irrespective of protein families. From this finding, Ts for each protein family has been estimated in relative to Ts for the PDZ family, which is determined by directly comparing with the experimental values of folding free energy changes, ΔΔGND, due to single amino acid substitutions. Also Tg and ΔGND for each protein family are estimated on the basis of the REM from the estimated Ts and an experimental melting temperature Tm. The estimates of Ts and Tg are all within a reasonable range, and those of ΔGND are well compared with experimental ΔGND for 5 protein families. The present method for estimating Ts is simpler than the method (Morcos et al., 2014) using AWSEM, and also is useful for the prediction of ΔGND, because the experimental data of ΔGND are limited in comparison with Tm, and also experimental conditions such as temperature and pH tend to be different among them. In addition, it has been revealed that ΔψN averaged over all single nucleotide nonsynonymous substitutions is a linear function of ψN/L of each homologous sequence, where L is sequence length; the average of ΔψN decreases as ψN/L increases. This characteristic is required for homologous proteins to stay at the equilibrium state of the native conformational energy GN ≃ kBTsψN, and indicates a weak dependency (Miyazawa, 2016; Serohijos et al., 2012) of ΔΔGND on ΔGND/L of protein across protein families.
The third purpose is to study an amino acid substitution process in protein evolution, which is characterized by the fitness, . We employ a monoclonal approximation for mutation and fixation processes of genes, in which protein evolution proceeds with single amino acid substitutions fixed at a time in a population. In this approximation, ψN of a protein gene attains the equilibrium, when the average of ΔψN( ≃ ΔΔψND) over singe nucleotide nonsynonymous mutations fixed in a population is equal to zero. Approximating the distribution of ΔψN due to singe nucleotide nonsynonymous mutations by a log-normal distribution, their distribution for fixed mutants is numerically calculated and used to calculate the averages of various quantities and also the probability density functions (PDF) of Ka/Ks in all arising mutants and also in fixed mutants only; Ka/Ks is defined as the ratio of nonsynonymous to synonymous substitution rate per site. There is a good agreement between the time average () and ensemble average (⟨ψN⟩σ), which is equal to the sample average, of ψN over homologous sequences, supporting the constancy of the standard deviation of ΔψN assumed in the monoclonal approximation.
We also study protein evolution at equilibrium, . The common understanding of protein evolution has been that amino acid substitutions observed in homologous proteins are neutral (Kimura, 1968; 1969; Kimura and Ohta, 1971; 1974) or slightly deleterious (Ohta, 1973; 1992), and random drift is a primary force to fix amino acid substitutions in population. The PDFs of Ka/Ks in all arising mutations and in their fixed mutations are examined to see how significant each of positive, neutral, slightly negative,and negative selections is. Interestingly, stabilizing mutations are significantly fixed in population by positive selection, and balance with destabilizing mutations that are also significantly fixed by random drift, although most negative mutations are removed from population. Contrary to the neutral theory (Kimura, 1968; 1969; Kimura and Ohta, 1971; 1974) and supporting the nearly neutral theory (Ohta, 1973; 1992; 2002), the proportion of neutral selection is not large even in fixed mutants. It is also confirmed that the effective temperature (Ts) of selection negatively correlates with the amino acid substitution rate (Ka/Ks) of protein at equilibrium.
2. Methods
2.1. Knowledge of protein folding
A protein folding theory (Pande et al., 1997; Ramanathan and Shakhnovich, 1994; Shakhnovich and Gutin, 1993a; 1993b), which is based on a random energy model (REM), indicates that the equilibrium ensemble of amino acid sequences, where σi is the type of amino acid at site i and L
is sequence length, can be well approximated by a canonical ensemble
with a Boltzmann factor consisting of the folding free energy, ΔGND(σ, T) and an effective temperature Ts representing the strength of selection pressure.
The
distribution of conformational energies in the denatured state (molten
globule state), which consists of conformations as compact as the native
conformation, is approximated in the random energy model (REM),
particularly the independent interaction model (IIM) (Pande et al., 1997),
to be equal to the energy distribution of randomized sequences, which
is then approximated by a Gaussian distribution, in the native
conformation. That is, the partition function Z for the denatured state is written as follows with the energy density n(E)
of conformations that is approximated by a product of a Gaussian
probability density and the total number of conformations whose
logarithm is proportional to the chain length.
2.2. Probability distribution of homologous sequences with the same native fold in sequence space
The probability distribution P(σ) of homologous sequences with the same native fold, where σi ∈ {amino
acids, deletion}, in sequence space with maximum entropy, which
satisfies a given amino acid frequency at each site and a given pairwise
amino acid frequency at each site pair, is a Boltzmann distribution (Marks et al., 2011; Morcos et al., 2011).
Hence, from Eqs. (2) and (9),
2.3. The equilibrium distribution of sequences in a mutation-fixation process
Here we assume that the mutational process is a reversible Markov process. That is, the mutation rate per gene, Mμν, from sequence to ν satisfies the detailed balance condition
For genic selection (no dominance) or gametic selection in a Wright-Fisher population of diploid, the fixation probability, u, of a single mutant gene, the selective advantage of which is equal to s and the frequency of which in a population is equal to was estimated (Crow and Kimura, 1970) as
This Markov process of substitutions in sequence is reversible, and the equilibrium frequency of sequence μ, Peq(μ), in the total process consisting of mutation and fixation processes is represented by
2.4. Relationships between m(σ), ψN(σ), and ΔGND(σ) of protein sequence
From Eqs. (1), (9), and (24), we can get the following relationships among the Malthusian fitness m, the folding free energy change ΔGND and ΔψND of protein sequence.
Eq. (33) indicates that evolutionary statistical energy ψ should be proportional to effective population size Ne, and therefore it is ideal to estimate one-body (h) and two-body (J) interactions from homologous sequences of species that do not significantly differ in effective population size. Also, Eq. (34) indicates that selective temperature Ts is inversely proportional to the effective population size Ne; Ts∝1/Ne, because free energy is a physical quantity and should not depend on effective population size.
2.5. The ensemble average of folding free energy, ΔGND(σ, T), over sequences
The ensemble average of ΔGND(σ, T) over sequences with Eq. (1) is
The ensemble averages of GN and ψN(σ) are estimated in the Gaussian approximation (Pande et al., 1997).
The folding free energy becomes equal to zero at the melting temperature Tm; . Thus, the following relationship must be satisfied (Pande et al., 1997; Ramanathan and Shakhnovich, 1994; Shakhnovich and Gutin, 1993a; 1993b).
2.6. Probability distributions of selective advantage, fixation rate and Ka/Ks
Let
us consider the probability distributions of characteristic quantities
that describe the evolution of genes. First of all, the probability
density function (PDF) of selective advantage s, p(s), of mutant genes can be calculated from the PDF of the change of ΔψND due to a mutation from μ to ν, . The PDF of 4Nes, may be more useful than p(s).
The PDF of fixation probability u can be represented by
The ratio of the substitution rate per nonsynonymous site (Ka) for nonsynonymous substitutions with selective advantage s to the substitution rate per synonymous site (Ks) for synonymous substitutions with s = 0 is
2.7. Probability distributions of ΔΔψND, 4Nes, u, and Ka/Ks in fixed mutant genes
The PDF of ΔΔψND in fixed mutants is proportional to that multiplied by the fixation probability.
3. Materials
3.1. Sequence data
We study the single domains of 8 Pfam (Finn et al., 2016) families and both the single domains and multi-domains from 3 Pfam families. In Table 1, their Pfam ID for a multiple sequence alignment, and UniProt ID and PDB ID with the starting- and ending-residue positions of the domains are listed. The full alignments for their families at the Pfam are used to estimate one-body interactions h and pairwise interactions J with the DCA program from “http://dca.rice.edu/portal/dca/home ” (Marks et al., 2011; Morcos et al., 2011). To estimate the sample () and ensemble (⟨ψN⟩σ) averages of the evolutionary statistical energy, M unique sequences with no deletions are used. In order to reduce phylogenetic biases in the set of homologous sequences, we employ a sample weight () for each sequence, which is equal to the inverse of the number of sequences that are less than 20% different from a given sequence in a given set of homologous sequences. Only representatives of unique sequences with no deletions, which are at least 20% different from each other, are used to calculate the changes of the evolutionary statistical energy (ΔψN) due to single nucleotide nonsynonymous substitutions; the number of the representatives is almost equal to the effective number of sequences (Meff) in Table 1.
Table 1. Protein families, and structures studied.
| Pfam family | UniProt ID | Na | Neffb,c | Md | Meffc,e | Lf | PDB ID |
|---|---|---|---|---|---|---|---|
| HTH_3 | RPC1_BP434/7-59 | 15315(15917) | 11691.21 | 6286 | 4893.73 | 53 | 1R69-A:6-58 |
| Nitroreductase | Q97IT9_CLOAB/4-76 | 6008(6084) | 4912.96 | 1057 | 854.71 | 73 | 3E10-A/B:4-76g |
| SBP_bac_3h | GLNH_ECOLI/27-244 | 9874(9972) | 7374.96 | 140 | 99.70 | 218 | 1WDN-A:5-222 |
| SBP_bac_3 | GLNH_ECOLI/111-204 | 9712(9898) | 7442.85 | 829 | 689.64 | 94 | 1WDN-A:89-182 |
| OmpA | PAL_ECOLI/73-167 | 6035(6070) | 4920.44 | 2207 | 1761.24 | 95 | 1OAP-A:52-146 |
| DnaB | DNAB_ECOLI/31-128 | 1929(1957) | 1284.94 | 1187 | 697.30 | 98 | 1JWE-A:30-127 |
| LysR_substrateh | BENM_ACIAD/90-280 | 25138(25226) | 20707.06 | 85(1) | 67.00 | 191 | 2F6G-A/B:90-280g |
| LysR_substrate | BENM_ACIAD/163-265 | 25032(25164) | 21144.74 | 121(1) | 99.27 | 103 | 2F6G-A/B:163-265g |
| Methyltransf_5h | RSMH_THEMA/8-292 | 1942(1953) | 1286.67 | 578(2) | 357.97 | 285 | 1N2X-A:8-292 |
| Methyltransf_5 | RSMH_THEMA/137-216 | 1877(1911) | 1033.35 | 975(2) | 465.53 | 80 | 1N2X-A:137-216 |
| SH3_1 | SRC_HUMAN:90-137 | 9716(16621) | 3842.47 | 1191 | 458.31 | 48 | 1FMK-A:87-134 |
| ACBP | ACBP_BOVIN/3-82 | 2130(2526) | 1039.06 | 161 | 70.72 | 80 | 2ABD-A:2-81 |
| PDZ | PTN13_MOUSE/1358-1438 | 13814(23726) | 4748.76 | 1255 | 339.99 | 81 | 1GM1-A:16-96 |
| Copper-bind | AZUR_PSEAE:24-148 | 1136(1169) | 841.56 | 67(1) | 45.23 | 125 | 5AZU-B/C:4-128g |
- a
The number of unique sequences and the total number of sequences in parentheses; the full alignments in the Pfam (Finn et al., 2016) are used.
- b
The effective number of sequences.
- c
A sample weight () for a given sequence is equal to the inverse of the number of sequences that are less than 20% different from the given sequence.
- d
The number of unique sequences that include no deletion unless specified. The number in parentheses indicates the maximum number of deletions allowed.
- e
The effective number of unique sequences that include no deletion or at most the specified number of deletions.
- f
The number of residues.
- g
Contacts are calculated in the homodimeric state for these protein.
- h
These proteins consist of two domains, and other ones are single domains.
4. Results
First, We describe how one-body and pairwise interactions, h and J, are estimated. Then, the changes of evolutionary statistical energy (ΔψN) due to single nucleotide nonsynonymous changes on natural sequences are analyzed with respect to dependences on the ψN of the wildtype sequences. The results indicate that the standard deviation of ΔGN ≃ kBTsΔψN is almost constant over protein families. Hence, the selective temperatures, Ts, of various protein families can be estimated in a relative scale from the standard deviation of ΔψN. The Ts of a reference protein is estimated by comparing the expected values of ΔΔGND with their experimental values. Folding free energies ΔGND are estimated from estimated Ts and experimental melting temperature Tm, and compared with their experimental values for 5 protein families. Glass transition temperatures Tg are also estimated from Ts and Tm.
Secondly, based on the distribution of ΔψN, protein evolution is studied. Evolutionary statistical energy (ψN) attains the equilibrium when the average of ΔψN over fixed mutations is equal to zero. The PDF of ΔψN is approximated by log-normal distributions. The basic relationships are that 1) the standard deviation of ΔψN is constant specific to a protein family, and 2) the mean of ΔψN linearly depends on ψN. The equilibrium value of ψN is shown to agree with the mean of ψN over homologous proteins in each protein family. In the present approximation, the standard deviation of ΔψN and selective temperature Ts at the equilibrium are simple functions of the equilibrium value of mean ΔψN, . Lastly, the probability distribution of Ka/Ks, which is the ratio of nonsynonymous to synonymous substitution rate per site, is analyzed as a function of in order to examine how significant neutral selection is in the selection maintaining protein stability and foldability. Also, it is confirmed that selective temperature Ts negatively correlates with the mean of Ka/Ks, which represents the evolutionary rate of protein.
4.1. Important parameters in the estimations of one-body and pairwise interactions, h and J, and of the evolutionary statistical energy, ψN(σ)
The one-body (h) and pairwise (J) interactions for amino acid order in a protein sequence are estimated here by the DCA method (Marks et al., 2011; Morcos et al., 2011), although there are multiple methods for estimating them (Ekeberg et al., 2014; 2013). In the case of the DCA method, the ratio of pseudocount (0 ≤ pc ≤ 1) defined in Eqs. (S.70) and (S.71) is a parameter and controls the values of the ensemble and sample averages of ψN in sequence space, ⟨ψN(σ)⟩σ in Eq. (42) and in Eq. (45); a weight for observed counts is defined to be equal to . Sample average means the average over all homologous sequences with a weight for each sequence to reduce phylogenetic biases. An appropriate value must be chosen for the ratio of pseudocount in a reasonable manner.
Another problem is that the estimates of h and J(Marks et al., 2011; Morcos et al., 2011)
may be noisy as a result of estimating many interaction parameters from
a relatively small number of sequences. Therefore, only pairwise
interactions within a certain distance are taken into account; the
estimate of J is modified as follows, according to Morcos et al. (2014).
Candidates for the cutoff distance may be about 8 Å for the first interaction shell and 15–16 Å for the second interaction shell between residues; distance between the centers of side chain atoms is employed for residue distance. Here both the distances are tested for the cutoff distance. Pseudocount in the Bayesian statistics is determined usually as a function of the number of samples (sequences), although the ratio of pseudocount was used for all proteins in the contact prediction (Morcos et al., 2011). Here, an appropriate value for the ratio of pseudocount for the certain cutoff distance, either about 8 Å or 15–16 Å, is chosen for each protein family in such a way that the sample average of the evolutionary statistical energies must be equal to the ensemble average, ; see Eqs. (42) and (46). As shown in Fig. S.1, the value of rcutoff, where is satisfied, monotonously changes as a function of the ratio of pseudocount pc. The values of pc, where is satisfied near the specified values of rcutoff, 8 Å and 15.5 Å, are employed for rcutoff ≃ 8 Å and 15.5 Å, respectively. In the present multiple sequence alignment for the PDZ domain, with the ratios of pseudocount and the sample and ensemble averages agree with each other at the cutoff distances rcutoff ∼ 8 Å and rcutoff ∼ 15.5 Å, respectively; see Fig. S.1. In Fig. S.2, the reflective correlation and regression coefficients between the experimental ΔΔGND (Gianni et al., 2007) and ΔψN due to single amino acid substitutions are plotted against the cutoff distance for pairwise interactions in the PDZ domain. The reflective correlation coefficient has the maximum at the rcutoff ∼ 8 Å for and at rcutoff ∼ 15.5 Å for , indicating that these cutoff distances are appropriate for these ratios of pseudocount. The ratio of pseudocount and a cutoff distance employed are listed for each protein family in Table 2 and S.5 for rcutoff ∼ 8 and 15.5 Å, respectively. The ratios of pseudocount employed here are all smaller than 0.5, which was reported to be appropriate for contact prediction; by using strong regularization, contact prediction is improved but the generative power of the inferred model is degraded (Barton et al., 2016). In the text, only results with rcutoff ∼ 8 Å are shown. In a supplement, results with rcutoff ∼ 15.5 Å are provided and discussed in comparison with the results of rcutoff ∼ 8 Å.
Table 2. Parameter values for rcutoff ∼ 8 Å employed for each protein family, and the averages of the evolutionary statistical energies () over all homologous sequences and of the means and the standard deviations of interaction changes ( and ) due to single nucleotide nonsynonymous mutations at all sites over all homologous sequences in each protein family.
| Pfam family | L | pc | nca | rcutoff | b | δψ2/Lb | b | c | c | ||||
|---|---|---|---|---|---|---|---|---|---|---|---|---|---|
| (Å) | Sd(Sd(ΔψN)) | for d | for Sd(ΔψN)e | ||||||||||
| HTH_3 | 53 | 0.18 | 7.43 | 8.22 | 2.7926 | 4.2572 | 5.3503 ± 0.5627 | ||||||
| Nitroreductase | 73 | 0.23 | 6.38 | 8.25 | 2.1597 | 3.3115 | 3.6278 ± 0.2804 | ||||||
| SBP_bac_3 | 218 | 0.25 | 9.23 | 8.10 | 2.1624 | 3.2955 | 3.4496 ± 0.2742 | ||||||
| SBP_bac_3 | 94 | 0.37 | 8.00 | 7.90 | 1.2495 | 1.9291 | 2.3436 ± 0.1901 | ||||||
| OmpA | 95 | 0.169 | 8.00 | 8.20 | 3.9093 | 6.5757 | 7.6916 ± 0.3078 | ||||||
| DnaB | 98 | 0.235 | 9.65 | 8.17 | 3.9976 | 6.3502 | 6.1244 ± 0.3245 | ||||||
| LysR_substrate | 191 | 0.235 | 8.59 | 7.98 | 1.4888 | 2.2784 | 2.6519 ± 0.1445 | ||||||
| LysR_substrate | 103 | 0.265 | 8.84 | 8.25 | 1.4144 | 2.2110 | 2.7371 ± 0.2055 | ||||||
| Methyltransf_5 | 285 | 0.13 | 7.99 | 7.78 | 7.2435 | 12.4689 | 10.9352 ± 0.3030 | ||||||
| Methyltransf_5 | 80 | 0.18 | 6.78 | 7.85 | 5.5162 | 8.9849 | 7.6133 ± 0.4382 | 0.125 | 0.1141 | ||||
| SH3_1 | 48 | 0.14 | 6.42 | 8.01 | 3.9109 | 5.5792 | 6.1426 ± 0.2935 | ||||||
| ACBP | 80 | 0.22 | 9.17 | 8.24 | 4.6411 | 7.7612 | 7.1383 ± 0.2970 | ||||||
| PDZ | 81 | 0.205 | 9.06 | 8.16 | 3.1140 | 4.7589 | 4.6605 ± 0.2255 | ||||||
| Copper-bind | 125 | 0.23 | 9.50 | 8.27 | 4.2450 | 7.2650 | 6.9283 ± 0.2316 | ||||||
- a
The average number of contact residues per site within the cutoff distance; the center of side chain is used to represent a residue.
- b
M unique sequences with no deletions are used with a sample weight () for each sequence; is equal to the inverse of the number of sequences that are less than 20% different from a given sequence. The M and the effective number Meff of the sequences are listed for each protein family in Table 1.
- c
The averages of and Sd(ΔψN), which are the mean and the standard deviation of ΔψN for a sequence, and the standard deviation of Sd(ΔψN) over homologous sequences. Representatives of unique sequences with no deletions, which are at least 20% different from each other, are used; the number of the representatives used is almost equal to Meff.
- d
The correlation and regression coefficients of on ψN/L; see Eq. (62).
- e
The correlation and regression coefficients of Sd(ΔψN) on ψN/L.
4.2. Changes of the evolutionary statistical energy, ΔψN, by single nucleotide nonsynonymous substitutions
The changes of the evolutionary statistical energy, ΔψN and ΔψD, due to a single amino acid substitution from to σi at site i in a natural sequence σN are defined as
We calculated the ψN of the wildtype and ΔψN
due to all types of single nucleotide nonsynonymous substitutions for
all homologous sequences, and their means and variances. We have
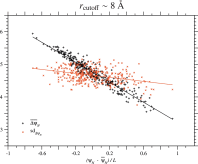
examined the dependence of on the ψN of each homologous sequence in each protein family. Fig. 1 for the PDZ family and Figs. S.3 to S.13 for all proteins show that is negatively proportional to the ψN/L of the wildtype, that is,
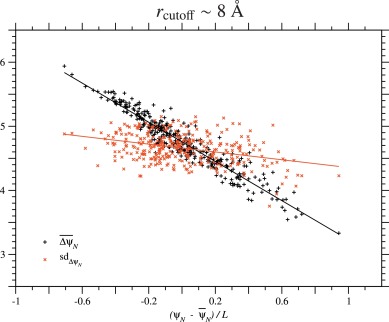
Fig. 1. Correlation between ΔψN due to single nucleotide nonsynonymous substitutions and ψN of homologous sequences in the PDZ domain family. This figure corresponds to the cutoff distance rcutoff ∼ 8 Å; see Fig. S.12 for rcutoff ∼ 15.5 Å. Each of the black plus or red cross marks corresponds to the mean or the standard deviation of ΔψN due to all types of single nucleotide nonsynonymous substitutions over all sites in each of the homologous sequences of the PDZ domain family. Only 335 representatives of unique sequences with no deletions, which are at least 20% different from each other, are employed; the number of the representatives is almost equal to Meff in Table 1. The solid lines show the regression lines for the mean and the standard deviation of ΔψN.
Is the same type of dependence on ψN/L found for the standard deviation of ΔψN over single nucleotide nonsynonymous substitutions at all sites? Fig. 1, Figs. S.3 to S.13 and Table 2 and S.5 show that the correlation between the standard deviation of ΔψN and ψN of the wildtype is very weak except for Nitroreductase, SBP_bac_3 and LysR_substrate families. Even for these protein families, the standard deviations of Sd(ΔψN) are less than 10% of the mean, ; see Table 2 and S.5. Thus, it is indicated that in general the variance/standard deviation of ΔψN due to single amino acid substitutions is almost constant irrespectively of the ψN across homologous sequences. The standard deviations of Sd(ΔψN) is relatively large for the HTH_3, because in Fig. S.3 there is a minor sequence group that has a distinguishable value of Sd(ΔψN) from the major sequence group.
4.3. Effective temperature Ts of selection estimated from the changes of interaction, ΔψN, by single nucleotide nonsynonymous substitutions
In the previous section, it has been shown that the standard deviation of ΔψN hardly depends on ψN
of the wildtype and is nearly constant across homologous sequences in
every protein family that has its own characteristic temperature (Ts) for selection pressure, indicating that Sd(ΔψN) must be approximated by a function of only kBTs. On the other hand, the free energy of the native structure, ΔGN, must not explicitly depend on kBTs, although it may be approximated by a function of GN. In other words, the following relationships are derived.
Table 3. Thermodynamic quantities estimated with rcutoff ∼ 8 Å.
| Experimental | ||||||||
|---|---|---|---|---|---|---|---|---|
| Pfam family | ra | a | Tm | b | Tc | ⟨ΔGND⟩d | ||
| (kcal/mol) | (°K) | (°K) | (°K) | (kB) | (°K) | (kcal/mol) | ||
| HTH_3 | – | – | 122.6 | 343.7 | 160.1 | 0.8182 | 298 | |
| Nitroreductase | – | – | 180.7 | 337 | 204.0 | 0.8477 | 298 | |
| SBP_bac_3 | – | – | 190.1 | 336.1 | 211.0 | 0.8771 | 298 | |
| SBP_bac_3 | – | – | 279.8 | 336.1 | 283.8 | 0.6072 | 298 | |
| OmpA | – | – | 85.2 | 320 | 125.4 | 0.9027 | 298 | |
| DnaB | – | – | 107.1 | 312.8 | 142.1 | 1.1341 | 298 | |
| LysR_substrate | – | – | 247.3 | 338 | 256.7 | 0.6908 | 298 | |
| LysR_substrate | – | – | 239.6 | 338 | 250.4 | 0.6472 | 298 | |
| Methyltransf_5 | – | – | 60.0 | 375 | 110.5 | 1.0656 | 298 | |
| Methyltransf_5 | – | – | 86.1 | 375 | 135.1 | 1.1214 | 298 | |
| SH3_1 | 0.865 | 0.1583 | 106.7 | 344 | 147.4 | 1.0253 | 295 | |
| ACBP | 0.825 | 0.1169 | 91.9 | 324.4 | 131.7 | 1.1281 | 278 | |
| PDZ | 0.931 | 0.2794 | 140.7 | 312.88 | 168.5 | 1.0854 | 298 | |
| Copper-bind | 0.828 | 0.1781 | 94.6 | 359.3 | 139.9 | 0.9709 | 298 |
- a
Reflective correlation (r) and regression () coefficients for least-squares regression lines of experimental ΔΔGND on ΔψN through the origin.
- b
Conformational entropy per residue, in kB units, in the denatured molten-globule state; see Eq. (18).
- c
Temperatures are set up for comparison to be equal to the experimental temperatures for ΔGND or to 298°K if unavailable; see Table S.4 for the experimental data.
- d
Folding free energy in kcal/mol units; see Eq. (44).
4.4. A direct comparison of the changes of interaction, ΔψN( ≃ ΔΔψND), with the experimental ΔΔGND due to single amino acid substitutions
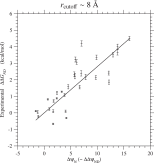
In order to determine the Ts for a reference protein, the experimental values (Gianni et al., 2007) of ΔΔGND due to single amino acid substitutions in the PDZ domain are plotted against the changes of interaction, ΔψN, for the same types of substitutions in Figs. 2 and S.14. The slope of the least-squares regression line through the origin, which is an estimate of kBTs, is equal to kcal/mol, and the reflective correlation coefficient is equal to 0.93. This estimate of kBTs for the PDZ yield kcal/mol, which corresponds to 76% of 1.7 kcal/mol (Serohijos et al., 2012) estimated from ProTherm database or 80% of 1.63 kcal/mol (Tokuriki et al., 2007) computationally predicted for single nucleotide mutations by using the FoldX. Using estimated from the Ts for PDZ, the absolute values of Ts for other proteins are calculated by Eq. (66) and listed in Table 3; see Table S.6 for rcutoff ∼ 15.5 Å. The Ts estimated with rcutoff ∼ 8 and 15.5 Å are compared with each other in Fig. S.15. Morcos et al. (2014) estimated Ts by comparing ΔψND with ΔGND estimated by the associative-memory, water-mediated, structure, and energy model (AWSEM). They estimated ψN with Å and probably . In Fig. S.16, the present estimates of Ts are compared with those by Morcos et al. (2014). The Morcos’s estimates of Ts with some exceptions tend to be located between the present estimates with rcutoff ∼ 8 Å and 15.5 Å which correspond to upper and lower limits for Ts as discussed in the Discussion and the supplement.
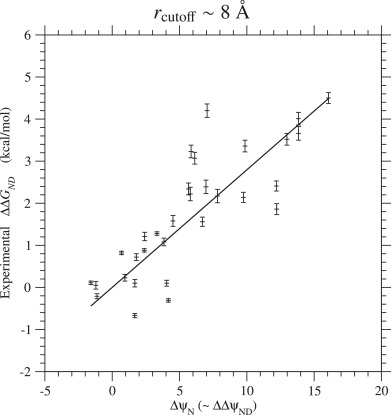
Fig. 2. Regression of the experimental values(Gianni et al., 2007) of folding free energy changes (ΔΔGND) due to single amino acid substitutions on ΔψN( ≃ ΔΔψND) for the same types of substitutions in the PDZ domain. This figure corresponds to the cutoff distance rcutoff ∼ 8 Å; see Fig. S.14 for rcutoff ∼ 15.5 Å. The solid line shows the least-squares regression line through the origin with the slope, 0.279 kcal/mol, which is the estimates of kBTs. The reflective correlation coefficient is equal to 0.93. The free energies are in kcal/mol units.
4.5. Relationship among of protein families; weak dependency of ΔΔGND on ΔGND/L
The weak dependence of ΔΔGND on ΔGND was found (Miyazawa, 2016; Serohijos et al., 2012)
from the analysis of stability changes due to single amino acid
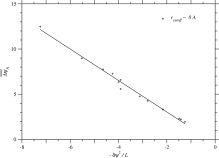
substitutions in proteins, which are collected in the ProTherm database (Kumar et al., 2006). To understand this weak dependence, let us consider the average of over homologous sequences in each protein family. The following regression line with is shown in Fig. 3.
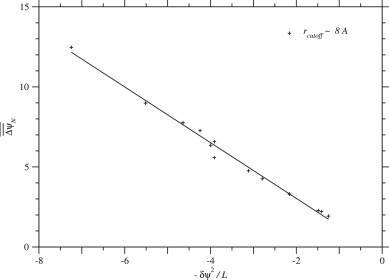
Fig. 3. Dependence of the average of due to single nucleotide nonsynonymous substitutions over homologous sequences on across protein families. Plus marks indicate the values for each protein family in the case of rcutoff ∼ 8 Å. The correlation coefficient is equal to 0.995, and the regression line is . See Fig. S.18 for rcutoff ∼ 15.5 Å.
Finally, the regression of ΔΔGND on ΔGND would be derived if Tg, Ts, and Twere constant.
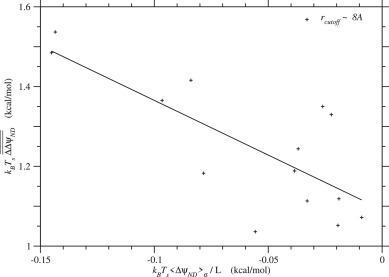
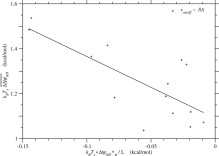
Fig. 4. The sample average of folding free energy change, is plotted against the ensemble average of folding free energy per residue, ⟨ΔGND⟩σ/L ≃ kBTs⟨ΔψND⟩σ/L, for each protein family. The correlation coefficient is and the regression line is . See Fig. S.19 for rcutoff ∼ 15.5 Å. The free energies are in kcal/mol units.
4.6. Estimation of Tg, ω, and ⟨ΔGND(σ)⟩σ from Ts and Tm
To estimate glass transition temperature Tg, the conformational entropy per residue ω in the compact denatured state, and the ensemble average of folding free energy in sequence space ⟨ΔGND⟩σ, melting temperature Tm must be known for each protein; see Eqs. (47), (18), and (44) for Tg, ω and ⟨ΔGND⟩σ, respectively. The experimental value of Tm (Armengaud et al., 2004; D’Auria et al., 2005; Ganguly et al., 2009; Guelorget et al., 2010; Knapp et al., 1998; Onwukwe et al., 2014; Parsons et al., 2006; Rosa et al., 1995; Sainsbury et al., 2008; Stupák et al., 2006; Torchio et al., 2012; Williams et al., 2002) employed for each protein is listed in Tables 3 and S.6. For comparison, temperature T is set up to be equal to the experimental temperature for ΔGND or to 298°K if unknown.
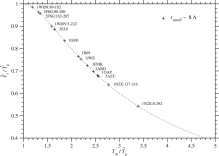
An estimate of glass transition temperature, has been calculated with and Tm by Eq. (47), and is listed in Tables 3 and S.6 for each protein. In Fig. 5, is plotted against for each protein family. Unless Tg < Tm, a protein will be trapped at local minima on a rugged free energy landscape before it folds into a unique native structure. Protein foldability increases as Tm/Tg increases. A condition, at for the first order transition requires that Eq. (47), which is indicated by a dotted curve in Fig. 5, must be satisfied. As a result, Ts/Tg must be lowered to increase Tm/Tg; in other words, proteins must be selected at lower Ts. The present estimates of Ts and Tg would be within a reasonable range (Morcos et al., 2014; Onuchic et al., 1995; Pande et al., 2000) of values required for protein foldability.

Fig. 5. is plotted against for each protein domain. A dotted curve corresponds to Eq. (47), . Plus marks indicate the values estimated with rcutoff ∼ 8 Å. See Fig. S.20 for rcutoff ∼ 15.5 Å. The effective temperature Ts for selection and glass transition temperature Tg must satisfy Ts < Tg < Tm for proteins to be able to fold into unique native structures.
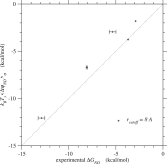
In Tables 3 and S.6, the ensemble average of ΔGND(σ) over sequences calculated by Eq. 44, and the conformational entropy per residue ω in the compact denatured state by Eq. (18) are also listed for each protein. Fig. 6 shows the comparison of their ensemble averages, ⟨ΔGND(σ)⟩σ, and the experimental values of ΔGND(σN) (Gianni et al., 2005; 2007; Grantcharova et al., 1998; Kragelund et al., 1999; Ruiz-Sanz et al., 1999; Wilson and Wittung-Stafshede, 2005) listed in Table S.4. The correlation in the case of rcutoff ∼ 8 Å is quite good, indicating that the constancy approximation (Eq. (65)) for the variance of ΔGN is appropriate. The conformational entropy per residue in the compact denatured state, in Eq. (18), estimated from the condition for the first order transition falls into the range of 0.60–1.13kB for rcutoff ∼ 8 Å, which agrees well with the range estimated by Morcos et al. (2014).

Fig. 6. Folding free energies, ⟨ΔGND⟩σ ≃ kBTs⟨ΔψND⟩σ, predicted by the present method are plotted against their experimental values, ΔGND(σN). Plus marks indicate the values estimated with rcutoff ∼ 8 Å. See Fig. S.21 for rcutoff ∼ 15.5 Å. The free energies are in kcal/mol units.
4.7. The equilibrium value of evolutionary statistical energy ψN in the mutation–fixation process of amino acid substitutions
Let us consider the fixation process of amino acid substitutions in a monoclonal
approximation, in which protein evolution is assumed to proceed with
single amino acid substitutions fixed at a time in a population. In this
approximation, ΔψND and ψN are at equilibrium and the ensemble of protein sequences attains to the equilibrium state, when the average of ΔΔψND ≃ ΔψN
over singe nucleotide nonsynonymous mutations fixed in a population is
equal to zero; an amino acid composition is assumed to be constant in
protein evolution.
The PDF of ΔΔGND were approximated with a normal distribution(Serohijos et al., 2012) or a bi-normal distribution (Tokuriki et al., 2007). Figs. 7,
S.22, and S.23, however, show that a single normal distribution with
the observed mean and standard deviation cannot well reproduce the
observed distribution of ΔψN due to single nucleotide nonsynonymous mutations. For simplicity, a log-normal distribution, for which x, μ and σ defined as follows, is arbitrarily used here to better reproduce observed distributions of ΔψN, particularly in the domain of although other distributions such as inverse Γ distributions can equally well reproduce the observed ones, too.
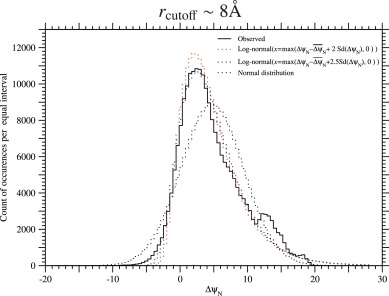
Fig. 7. The observed frequency distribution and the fitted distributions of ΔψN in the PDZ protein family. A black solid line indicates the observed frequency distribution of ΔψN per equal interval in homologous sequences of the PDZ protein family, and red dotted and blue dotted lines indicate the total frequencies of log-normal distributions with or 2.5 and parameters estimated with the mean and variance of the observed distribution for each protein; see Eqs. 74) to (78). A black dotted line indicates the total frequencies of normal distributions the mean and variance of which are equal to those of the observed distribution for each protein. Only representatives of unique sequences with no deletions, which are at least 20% different from each other, are employed; the total count is equal to 222,466 over 335 homologous sequences, which is almost equal to Meff in Table 1. See Fig. S.22 for rcutoff ∼ 15.5 Å.
The average of ΔψN over fixed mutants is uniquely determined by the distribution of ΔΔψN( ≃ ΔψN), which is approximated here by a log-normal distribution estimated from the mean and variance of ΔψN; it depends also on qm, which is assumed to be constant, through fixation probability, because . In other words, ⟨ΔψN⟩fixed is uniquely determined by the mean and variance of ΔψN. Therefore, under the equilibrium condition only one of the mean and variance can be freely specified, and the other is uniquely determined. We employ or ψN as a parameter, because depends on ψN, and only one of them can be specified. We define as at which .
Suppose that the regression equation, Eq. (62), of ΔψN on ψN is exact, and the standard deviation of ΔψN is constant irrespective of ψN; the slope (), and that are estimated with rcutoff ∼ 8 Å for the PDZ and listed in Table 2 are employed here. In Fig. 8, the average of ΔψN over single nucleotide nonsynonymous substitutions fixed in a population, ⟨ΔψN⟩fixed, is plotted against ψN/L of a wildtype for the PDZ protein family. This figure shows that ⟨ΔψN⟩fixed changes its value from positive to negative as ψN increases, that is, the value of ψN at which is the stable equilibrium value for ψN. In order for protein to have such a stable equilibrium value for folding free energy (ΔGND ≃ kBTsΔψND), the regression coefficient of on ψN must be more negative than that of the standard deviation, Sd(ΔψN), because otherwise stabilizing mutations increase as ψN decreases. This condition is, of course, satisfied for all protein families studied here, because the mean of ΔψN over all substitutions at all sites is negatively proportional to ψN of a wildtype, but its standard deviation is nearly constant irrespective of ψN across homologous sequences; see Tables 2 and S.5.
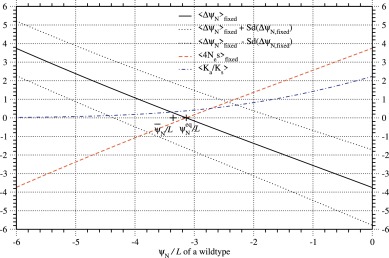
Fig. 8. The average of ΔψN( ≃ ΔΔψND) over fixed single nucleotide nonsynonymous mutations versus ψN/L of a wildtype for the PDZ protein family. The averages of ΔψN( ≃ ΔΔψND) and 4Nes over the fixed mutants, and the average of Ka/Ks( ≡ u(s)/u(0)) over all the mutants are plotted against ψN/L of a wildtype by solid, broken, and dash-dot lines, respectively; is assumed. Dotted lines show the values of ⟨ΔψN⟩fixed ± sd, where the sd is the standard deviation of ΔψN over fixed mutants. Fixation probability has been calculated with ΔΔψND ≃ ΔψN; see Eqs. (21) and (33). Here the empirical relationships of Eqs. (62) and (63) are assumed; that is, the mean of ΔψN linearly decreases as ψN increases, but the standard deviation of ΔψN is constant irrespective of ψN. The slope () and intercept () and the average of Sd(ΔψN) over homologous sequences that are estimated with rcutoff ∼ 8Å for the PDZ and listed in Table 2 are employed here. The distribution of ΔψN due to single nucleotide nonsynonymous mutations is approximated by a log-normal distribution with ; see Eqs. (74) to (78). The where is the stable equilibrium value of ψN in the protein evolution of the PDZ protein family. The is close to the average of ψN over homologous sequences (), indicating that the present approximations for and for are consistent to each other.
The equilibrium value of ψN for each protein domain is calculated with the estimated values of and listed in Tables 2 and S.5; it should be noticed here that is assumed to be constant. In Figs. 9 and S.26, the equilibrium values of ψN/L estimated with and 2.5 in the monoclonal approximation are plotted against the average of ψN/L over homologous sequences for each protein family. The agreement between the time average () and ensemble average ()) is better for rcutoff ∼ 8 Å than for rcutoff ∼ 15.5 Å and is not bad in the case of rcutoff ∼ 8 Å, indicating that the present methods for the fixation process of amino acid substitutions and for the equilibrium ensemble of ψN give a consistent result with each other, and also that it is a good approximation to assume the standard deviation of ΔψN not to depend on ψN in each protein family.
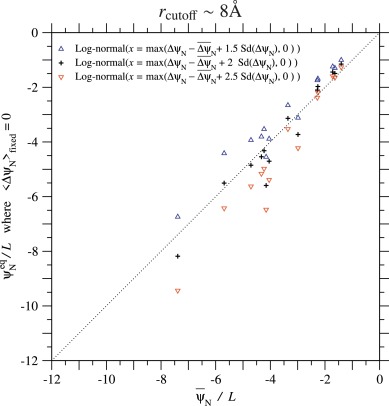
Fig. 9. The equilibrium value of ψN/L, where is plotted against the average of ψN/L over homologous sequences for each protein family. The cutoff distance Å is employed to estimate ψN of each protein family; see Fig. S.26 for Å. The equilibrium values where are calculated by using the linear dependency of on ψN (Eq. (62)) and estimated values with rcutoff ∼ 8 in Table 2. The standard deviation of ΔψN is approximated to be constant and equal to ; see Eq. (63). Plus, upper triangle, and lower triangle marks indicate the cases of log-normal distributions with and 2.5 employed to approximate the distribution of ΔψN, respectively; see Eqs. (74) to (78).
4.8. Relationships between and the standard deviation of ΔψN, and at equilibrium
In the present model, the equilibrium values, and the corresponding are functions of the mean and standard deviation of ΔψN only, because the distribution of ΔΔψND( ≃ ΔψN) is approximately estimated with the mean and standard deviation of ΔψN. On the other hand, and should be equal to and respectively; the time average and ensemble average should be consistent. Actually almost agrees with as shown in Fig. 9. Therefore the standard deviation of ΔψN is uniquely determined from its mean as long as ψN and are at equilibrium; conversely the equilibrium value of is determined by Sd(ΔψN). In Fig. 10, the standard deviation of ΔψN is plotted against . Likewise the estimate of effective temperature of selection, and that of folding free energy change, are plotted as a function of in Fig. 11. These figures show that the averages, and over homologous sequences scatter along the expected curves.
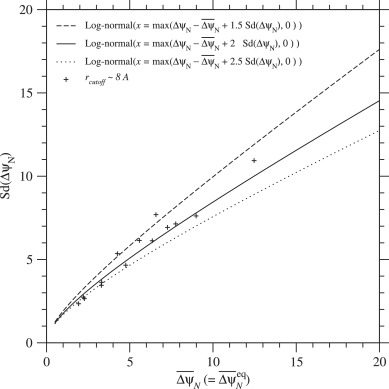
Fig. 10. Relationship between the mean and the standard deviation of ΔψN due to single nucleotide nonsynonymous mutations at equilibrium, . The standard deviation of ΔψN that satisfies is plotted against its mean, . Broken, solid, and dotted lines indicate the cases of log-normal distributions with and 2.5 employed to approximate the distribution of ΔψN, respectively; see Eqs. (74) to (78). Plus marks indicate the averages, and over homologous sequences in each protein family for rcutoff ∼ 8 Å, which are listed in Table 2. See Fig. S.27 for rcutoff ∼ 15.5 Å.
4.9. Protein evolution at equilibrium,
The common understanding of protein evolution has been that amino acid substitutions observed in homologous proteins are neutral (Kimura, 1968; 1969; Kimura and Ohta, 1971; 1974) or slightly deleterious (Ohta, 1973; 1992), and random drift is a primary force to fix amino acid substitutions in population. In order to see how significant neutral/slightly deleterious substitutions are in protein evolution, the PDFs of Ka/Ks in all single nucleotide nonsynonymous mutations and in their fixed mutations are calculated; Ka/Ks is the ratio of nonsynonymous to synonymous substitution rate per site (Miyata and Yasunaga, 1980) and defined here as Ka/Ks ≡ u(s)/u(0), where u(s) is a fixation probability for selective advantage s; see Eq. (50).
First let us see the distributions of ΔψN at equilibrium, . Fig. 12 shows the PDFs of ΔψN in all single nucleotide nonsynonymous mutations and in their fixed mutations as a function of respectively. Because the PDFs of ΔψN can be regarded as the PDFs of . At equilibrium, the distribution of ΔψN in all single nucleotide nonsynonymous mutants becomes wider as the mean of ΔψN increases, however, that in fixed mutants remains to be narrow with a peak near zero.
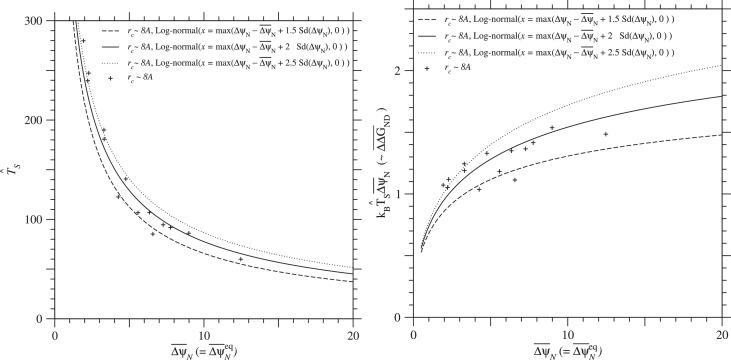
Fig. 11. Relationships between and and between and at equilibrium, . The estimate of effective temperature for selection and the estimate of mean folding free energy change, are plotted against under the condition of . The Ts is estimated in relative to the Ts of the PDZ family in the approximation that the standard deviation of ΔGN due to single nucleotide nonsynonymous mutations is constant irrespective of protein families; see Eq. (65). Broken, solid, and dotted lines indicate the cases of log-normal distributions with and 2.5 employed to approximate the distribution of ΔψN, respectively; see Eqs. (74) to (78). Plus marks indicate those estimates against the average of over homologous sequences for each protein family with rcutoff ∼ 8Å, which are listed in Tables 2 and 3. See Fig. S.28 for rcutoff ∼ 15.5Å.
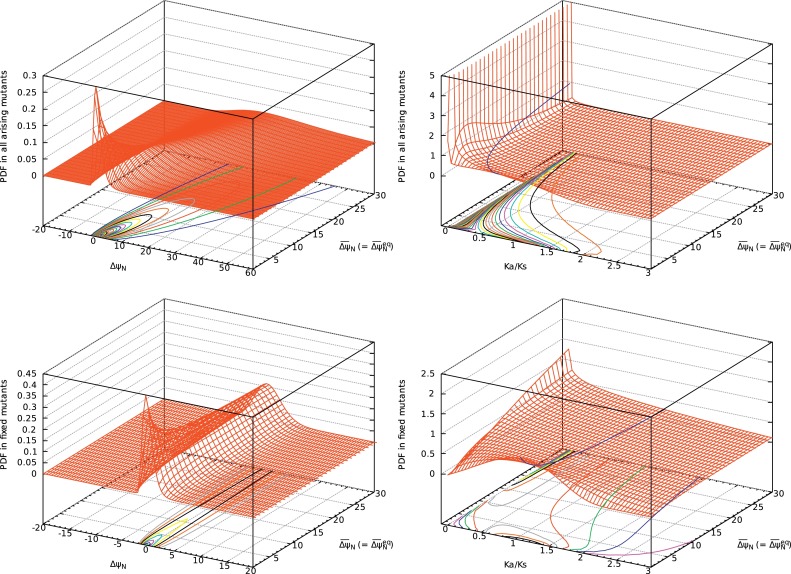
Fig. 12. PDFs of ΔψN (left) and Ka/Ks (right) in all singe nucleotide nonsynonymous mutants (upper) and in their fixed mutants (lower) as a function of at equilibrium, . Fixation probability has been calculated with ΔΔψND ≃ ΔψN; see Eqs. (21) and (33). The distribution of ΔψN due to single nucleotide nonsynonymous mutations is approximated by a log-normal distribution with ; see Eqs. (74) to (78). The standard deviation of ΔψN is determined to satisfy at .
The PDFs of Ka/Ks in all single nucleotide nonsynonymous mutations and in their fixed mutations are shown in Fig. 12. The blue line on the landscape of the PDF shows the averages of Ka/Ks. The averages of Ka/Ks in all single nucleotide nonsynonymous mutations and in their fixed mutations are also shown in Fig. 13. The average of Ka/Ks in all the arising mutants is less than 1 and decreases as increases, indicating that negative mutants significantly occur and increase as increases. On the other hand, ⟨Ka/Ks⟩fixed in fixed mutants is larger than 1 and increases as increases, indicating that positive mutants fix significantly in population and increase as equilibrium folding free energy change increases, that is, equilibrium protein stability decreases. To see each contribution of positive, neutral, slightly negative and negative selections, the value of Ka/Ks is divided arbitrarily into four categories, Ka/Ks > 1.05, 1.05 > Ka/Ks > 0.95, 0.95 > Ka/Ks > 0.5, and 0.5 > Ka/Ks for their selection categories, respectively. The probabilities of each selection category in all single nucleotide nonsynonymous mutations and in their fixed mutations are shown in Fig. 14. The almost 50% of fixed mutations are stabilizing mutations fixed by positive selection (1.05 < Ka/Ks), and another 50% are destabilizing mutations fixed by random drift. They are balanced with each other, and the stability of protein is maintained. Contrary to the neutral theory (Kimura, 1968; 1969; Kimura and Ohta, 1971; 1974), the proportion of neutral selection is not large even in fixed mutations, and slightly negative mutations are significantly fixed. Neutral mutations fixed with 0.95 < Ka/Ks < 1.05 are only less than 10%, and slightly negative mutations fixed with 0.5 < Ka/Ks < 0.95 and negative mutations fixed with Ka/Ks < 0.5 are both from 10 to 30%. The nearly neutral theory (Ohta, 1973; 1992; 2002) insists that most fixed mutations satisfy |Nes| ≤ 2. This condition corresponds to ; see Eqs. (21) and (50). The PDF of Ka/Ks shown in Fig. 14 indicates that this condition is satisfied, supporting the nearly neutral theory.
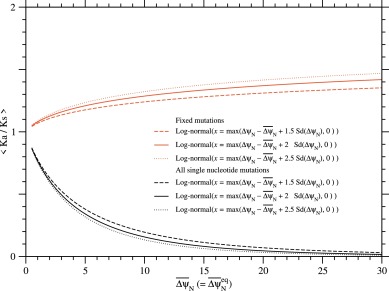
Fig. 13. The averages of Ka/Ks over all single nucleotide nonsynonymous mutations and over their fixed mutations as a function of at equilibrium, . Black and red lines indicate ⟨Ka/Ks⟩ and ⟨Ka/Ks⟩fixed, respectively. Fixation probability has been calculated with ΔΔψND ≃ ΔψN; see Eqs. (21) and (33). Broken, solid, and dotted lines indicate the cases of log-normal distributions with and 2.5 employed to approximate the distribution of ΔψN, respectively; see Eqs. (74) to (78). The standard deviation of ΔψN is determined to satisfy at .
4.10. Relationship between Ts and Ka/Ks
The effective temperature (Ts) of protein for selection, which is defined in Eq. (1), represents the strength of selection originating from protein stability and foldability. Thus, it must be related with the evolutionary rate (amino acid substitution rate) of protein. As the effective temperature of selection (Ts) decreases, the mean change of evolutionary statistical energy () due to single amino acid substitutions increases; see Fig. 11. Therefore, destabilizing mutations increase, and an amino acid substitution rate is expected to decrease. Fig. 13 shows that the average of Ka/Ks decreases as increases. The direct relationship between substitution rate and is shown in Fig. 15; the average of Ka/Ks decreases as Ts increases. In the selection maintaining protein foldability/stability, the effective temperature of selection is directly reflected in the average amino acid substitution rate.
5. Discussion
A main purpose of the present study is to formulate protein fitness originating from protein foldability and stability. From a phenomenological viewpoint, Drummond and Wilke (2008) took notice of toxicity of misfolded proteins as well as diversion of protein synthesis resources, and formulated a Malthusian fitness of a genome to be negatively proportional to the total amount of misfolded proteins, which must be produced to obtain the necessary amount of folded proteins (Serohijos et al., 2012). They also formulated a Malthusian fitness based on protein dispensability to be negatively proportional to the ratio of unfolded proteins. These formulas of protein fitness can be well approximated by a generic form, where T is growth temperature, and κ( ≥ 0) is a parameter that depends on protein disability and cellular abundance of protein (Miyazawa, 2016).
In the comparison of this generic formula of protein fitness with the present one, it may be interpreted that if |ΔGND/(kBT)| ≪ 1, however, the growth temperature T and folding free energy do not always satisfy this condition. These two types of selection should be considered to be the different types of selection, although both are related with protein stability (ΔGND). Selective advantage of mutant is not upper-bounded in the present scheme of a Malthusian fitness but in the case of . As a result, PDFs of Ka/Ks in all arising mutations and in fixed mutations have very different shapes between these two formulas of fitness (Miyazawa, 2016). Selection modeled here is one that yields the distribution of homologous sequences in protein evolution. In other word, the present formula for protein fitness models natural selection maintaining protein’s stability, foldability, and function over the evolutionary time scale, which is much longer than the time scale for the selection originating from toxicity of misfolded proteins.
The present formulas for protein fitness, Eqs. (31) and (30), have been derived on the basis of a protein folding theory, particularly the random energy model, and the maximum entropy principle for the distribution of homologous sequences with the same fold in sequence space, respectively. The former indicates that the equilibrium ensemble of sequences can be well approximated by a canonical ensemble with the Boltzmann factor and the latter insists that the probability distribution of homologous sequences, which satisfies a given amino acid composition at each site and a given pairwise amino acid frequency at each site pair, can be represented as a Boltzmann distribution with in which the evolutionary statistical energy (ψN) is represented as the sum of one-body (compositional) and pairwise (covariational) interactions between sites. On the other hand, assuming mutation and fixation processes to be reversible Markov processes leads us to a formulation that the equilibrium ensemble of sequences also obeys a Boltzmann distribution with . As a result, we obtain the correspondences between folding free energy (), and and protein fitness (): the equality between the latter two variables (Eq. (33)), which indicates that ΔψN is proportional to fitness (s), and the approximate equality between the former two variables (Eq. (34)) since a canonical ensemble with ΔGND/(kBTs) is an approximate for the sequence ensemble under natural selection. A discrepancy between evolutionary statistical energies Jij and actual interaction energies was pointed out for non-contacting residue pairs in Monte Carlo simulations of lattice proteins (Jacquin et al., 2016). Also, the ratio of to the corresponding actual contact energy was shown to differ among contact site pairs. On the other hand, Hopf et al. (2017) successfully predicted mutation effects with evolutionary statistical energy and showed that the change of evolutionary statistical energy (ΔψN) due to amino acid substitutions can capture experimental fitness landscapes and identify deleterious human variants.
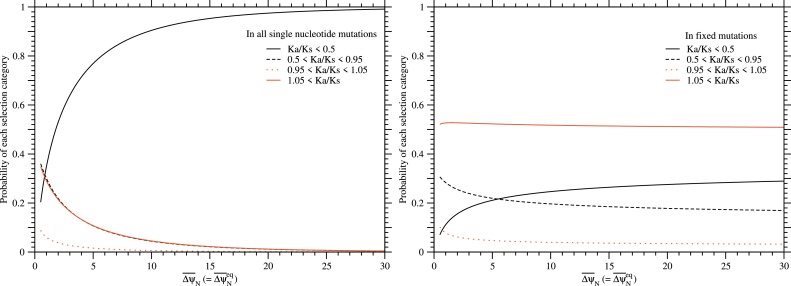
Fig. 14. The probabilities of each selection category in all single nucleotide nonsynonymous mutations and in their fixed mutations as a function of at equilibrium, . The left and right figures are for single nucleotide nonsynonymous mutations and for their fixed mutations, respectively. Red solid, red dotted, black broken, and black solid lines indicate positive, neutral, slightly negative and negative selection categories, respectively; the values of Ka/Ks are divided arbitrarily into four categories, Ka/Ks > 1.05, 1.05 > Ka/Ks > 0.95, 0.95 > Ka/Ks > 0.5, and 0.5 > Ka/Ks, which correspond to their selection categories, respectively. Fixation probability has been calculated with ΔΔψND ≃ ΔψN; see Eqs. (21) and (33). The distribution of ΔψN due to single nucleotide nonsynonymous mutations is approximated by a log-normal distribution with ; see Eqs. (74) to (78). The standard deviation of ΔψN is determined to satisfy at .
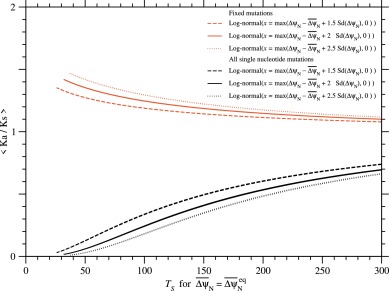
Fig. 15. The averages of Ka/Ks over all single nucleotide nonsynonymous mutations and over their fixed mutations as a function of the effective temperature of selection, at equilibrium, . Black and red lines indicate ⟨Ka/Ks⟩ and ⟨Ka/Ks⟩fixed, respectively. Fixation probability has been calculated with ΔΔψND ≃ ΔψN; see Eqs. (21) and (33). The distribution of ΔψN due to single nucleotide nonsynonymous mutations is approximated by a log-normal distribution with ; see Eqs. (74) to (78). The standard deviation of ΔψN is determined to satisfy at . The Ts is estimated in the scale relative to the Ts of the PDZ family in the approximation that the standard deviation of ΔGN due to single nucleotide nonsynonymous mutations is constant irrespective of protein families; see Eq. (65). Broken, solid, and dotted lines indicate the cases of log-normal distributions with and 2.5 employed to approximate the distribution of ΔψN, respectively; see Eqs. (74) to (78). The curves for rcutoff ∼ 8 and 15.5 Å almost overlap with each other, because the estimates of for the PDZ with rcutoff ∼ 8 and 15.5 Å are almost equal to each other.
In the analysis of the interaction changes (ΔψN) due to single nucleotide nonsynonymous substitutions, we have employed the cutoff distances for pairwise interactions, rcutoff ∼ 8 and 15.5 Å, which correspond to the first and second interaction shells between residues, respectively. Both the cutoff distances yield similar values for ; see Fig. S.15. Thus, the differences in the estimation of Ts between these two cutoff distances principally originate in the estimation of Ts for the reference protein, PDZ. The absolute value of for the PDZ has been estimated to be equal to the slope of the reflective regression line of ΔΔGND on ΔψN. Therefore, as long as the correlation between ΔΔGND and ΔψN is good enough as shown in Figs. 2 and S.14, takes a similar value irrespective of rcutoff, and the estimate differs depending on . Thus, ΔψN must correlate with experimental ΔΔGND, but on the basis of the correlation coefficient one cannot determine which estimation of ΔψN is better. Larger the standard deviation of ΔψN is, the smaller the estimate of Ts from a direct comparison between ΔΔGND and ΔψN is. Including the longer range of pairwise interactions tend to increase the variance of ΔψN. The range of interactions must be limited to a realistic value, either the first interaction shell or the second interaction shell. Thus, the estimates of Ts with rcutoff ∼ 8 Å and 15.5Å would be upper and lower limits, respectively. Unfortunately Ts is not directly observable. Comparison of the estimates of folding free energies with their experimental values may be appropriate to judge which value is more appropriate for the cutoff distance, although the number of experimental data is limited. Actual values of Ts may be closer to the estimates with rcutoff ∼ 8Å, because contact predictions based on the estimate of pairwise interactions J succeed for close contacts within the first interaction shell. Also, the estimation of ΔGND and the correlation between and are slightly better with rcutoff ∼ 8 Å than 15.5 Å; see Figs. 6, 9, S.21, and S.26.
On the basis of the random energy model(REM) (Pande et al., 1997; Shakhnovich and Gutin, 1993a; 1993b), glass transition temperatures (Tg) and folding free energies (ΔGND) for 14 protein domains are estimated under the condition of . The first order transition for protein folding is assumed to estimate the folding free energies by Eq. (44). Selective temperature, Ts, is estimated in the empirical approximation that the standard deviation of ΔψN is constant across homologous sequences with different ψN, so that their estimates may be more coarse-grained, however, this method is easier and faster than the method (Morcos et al., 2014) using the AWSEM (Davtyan et al., 2012). Experimental data for ΔGND are very limited, and also experimental conditions such as temperature and pH tend to be different among them. A prediction method for folding free energy would be useful in such a situation, although the present method requires the knowledge of melting temperature (Tm) besides sequence data, however, experimental data of Tm are more available than for ΔGND.
For proteins to have a stable equilibrium value of ψN in protein evolution, the regression coefficient of mean interaction change () on ψN must be more negative than that of their standard deviation (Sd(ΔψN)), otherwise stabilizing mutations increase as ψN decreases. Actually Tables 2 and S.5 show that their mean over all the substitutions at all sites is negatively proportional to ψN of a wildtype, but their standard deviation is nearly constant irrespective of ψN across homologous sequences. The equilibrium value where the average of ΔψN over fixed mutants is equal to zero, is calculated with the approximation of the distribution of ΔψN by a log-normal distribution and the empirical rules of Eqs. (62) and (63). In the monoclonal approximation, it has been confirmed that the time average () and ensemble average () of evolutionary statistical energy (ψN) almost agree with each other. Therefore, this result also supports these approximations and empirical rules, particularly Eq. (63), that is, the constancy of the standard deviation of ΔψN across homologous sequences. In the log-normal distribution approximation, Sd(ΔψN)eq, and can be determined as a function of any one of them. Here they have been shown as a function of .
We have also studied the evolution of protein at equilibrium, at which the ensemble of homologous sequences obeys a Boltzmann distribution with and the ensemble averages of evolutionary statistical energy (ψN ≃ GN/(kBTs)) and its change due to a mutation (ΔψN) ≃ ΔΔψND ≃ ΔΔGND/(kBTs)) agree with their steady values; and . The PDFs of ΔψN and Ka/Ks in all the mutants and in their fixed mutants have been estimated. It is confirmed that the effective temperature (Ts) of selection negatively correlates with the amino acid substitution rate (Ka/Ks) of protein.
New alleles can become fixed owing to random drift or to positive selection of substantially advantageous mutations (Gillespie, 1991; Kimura, 1983; Ohta, 2002). The present study indicates that the stability of protein is maintained in such a way that stabilizing mutations are significantly fixed by positive selection, and balance with destabilizing mutations fixed by random drift. As shown in Fig. 14, the almost 50% of fixed mutations are stabilizing mutations fixed by positive selection (1.05 < Ka/Ks), and another 50% are destabilizing mutations fixed by random drift. An interesting fact is that contrary to the neutral theory (Kimura, 1968; 1969; Kimura and Ohta, 1971; 1974), the proportion of neutral selection is not large even in fixed mutants. In the selection to maintain protein stability/foldability, neutral mutations fixed with 0.95 < Ka/Ks < 1.05 are only less than 10%, and slightly negative mutations fixed with 0.5 < Ka/Ks < 0.95 and negative mutations fixed with Ka/Ks < 0.5 are both from 10 to 30%. As a result, at equilibrium the average of Ka/Ks in all the mutants is less than 1, but that in their fixed mutants is larger than 1. The PDF of Ka/Ks shown in Fig. 14 supports the nearly neutral theory (Ohta, 1973; 1992; 2002), which insists that most fixed mutations satisfy |Nes| ≤ 2 corresponding to . It should be noted that these conclusions based on the PDFs of ΔψN and Ks/Ks require only an equilibrium condition of = but does not require the approximation of constancy for the variance of ΔψN across homologous sequences, which is used only to estimate Ts and and other relations based on Ts.
In the present study, we have analyzed the mutation-fixation process in equilibrium. The equilibrium state will vary if an environmental condition varies. The evolutionary statistical energy ψN and the inverse of selective temperature 1/Ts are linearly proportional to the effective population size Ne, as indicated by Eq. (33). Thus, the equilibrium values, and Sd(ΔψN)eq, are all linearly proportional to the effective population size Ne. On the other hand, Sd(ΔψN)eq is not linearly proportional to but downward-concave, as shown in Fig. 10. As a result, as Ne decreases, decreases. In other words, the equilibrium value of the mean folding free energy change becomes less positive and therefore that of folding free energy is expected to be higher (less stable) for a smaller number of effective population size Ne; see Eq. (72).
Supplementary document
File 1 — Supplementary methods, tables, and figures
A PDF file in which the details of the methods are described and additional tables and figures are provided; methods, tables, and figures provided in the text are also included as part of their full descriptions for reader’s convenience.
Funding This research did not receive any specific grant from funding agencies in the public, commercial, or not-for-profit sectors.
Acknowledgement
I would like to thank a reviewer for his excellent comments and suggestions that have helped me improve the paper considerably.
Appendix A. Supplementary materials
Supplementary Data S1. Supplementary Raw Research Data. This is open data under the CC BY license http://creativecommons.org/licenses/by/4.0/